The high collision intersection ranking results appear in the main query window. The collisions included in the rankings are based on any filters that you set and the definition for intersection related collisions.
After specifying the any filters and the definition for intersection related collisions, you will see a number of options in the show results section. An example output is shown below:
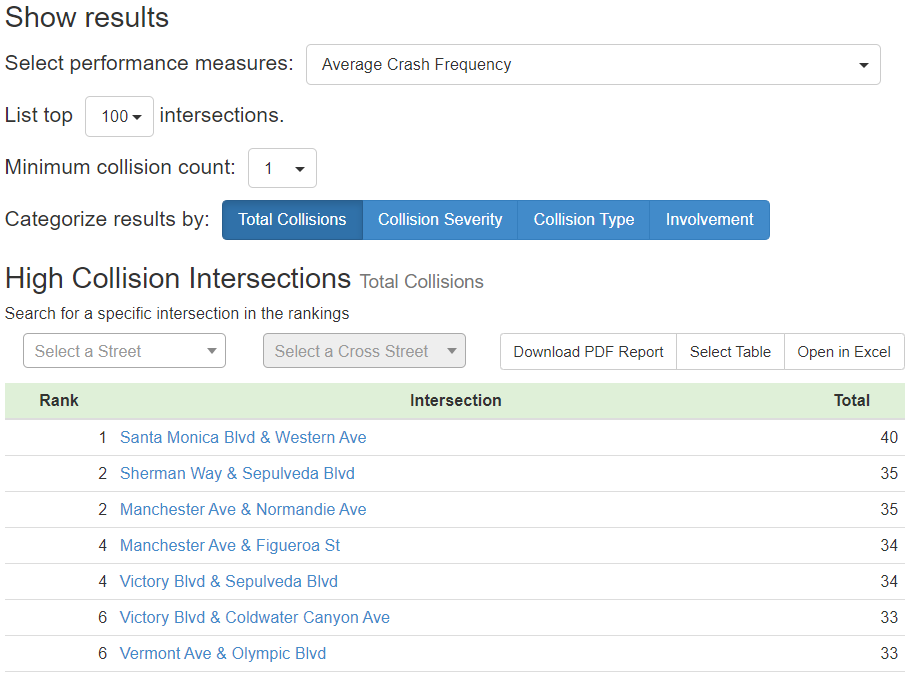
The options available for your agency will differ depending on your custom setup. The default safety performance measure is the average crash frequency. You can also select the number of intersections to display and a minimum collision count for intersections to be included. After defining these options, you can then select how to categorize the results. Clicking on any of the category buttons such as Total Collisions will then display the results table.
You can then export the rankings to a PDF or Excel table. You will also notice that the intersections are shown as hyperlinks. Clicking on any individual intersection will open the full results window for that location to explore the collisions in the map, diagram or charts.
You also have the ability to search for a specific intersection in the list using the search box option on the top left of the results. This allows you to easily find a location in a long list.