The map results page provides an interface to spatially explore the collisions. Each of the sections on the page and the included functionality will be described in this article.
Map Widgets
All functionality and tools to interact with the map can be accessed via map widgets in the corners of the map.
Toggle Crashes Visualization
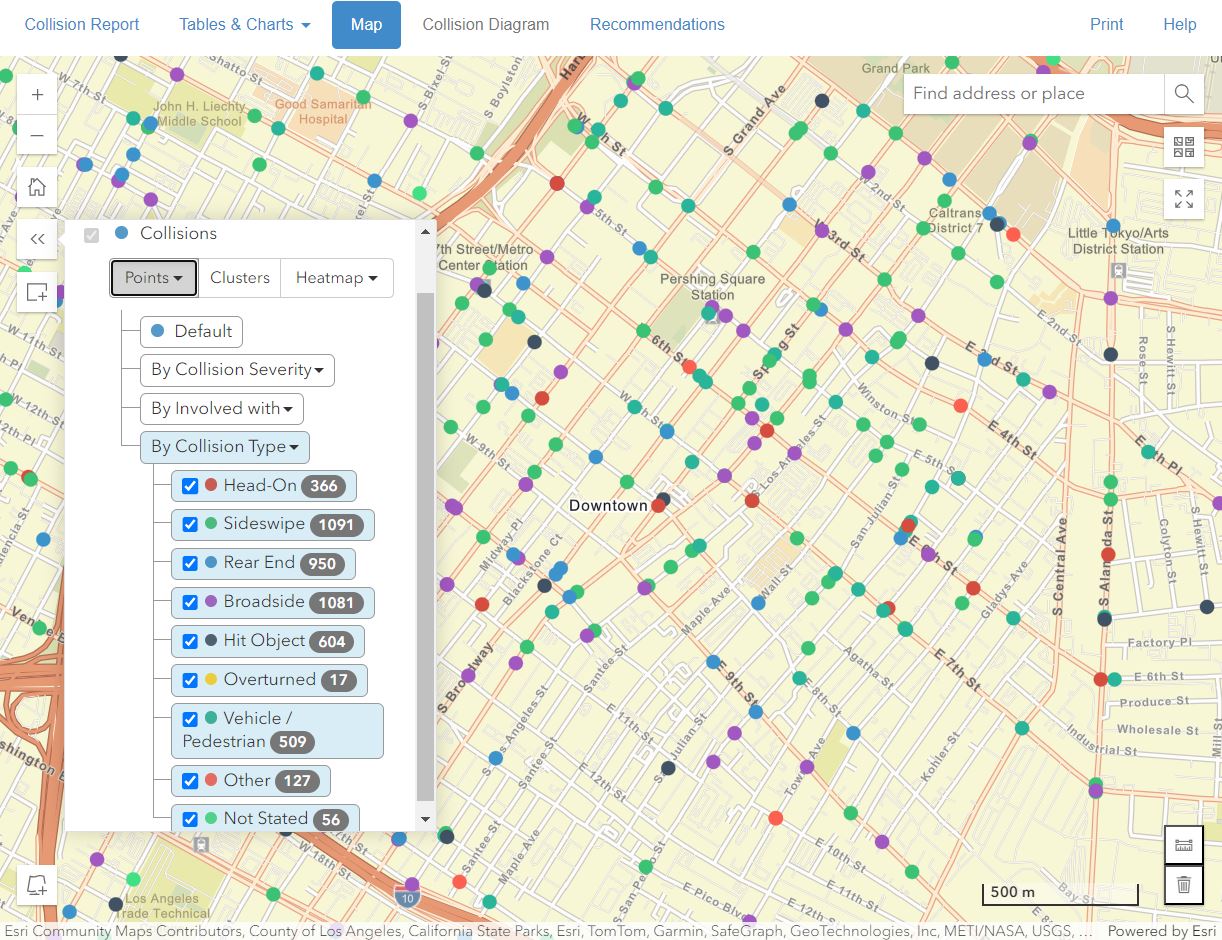
The layer tree icon button widget allows you to modify how to visualize the crashes on the map. The collisions can be shown as individual points, clusters, or as a heatmap by clicking on the specific tab. Descriptions of each are as follows:
-
Points: The default view displays each collision as a blue circle on the map. If you click the Points tab, you will also see several different symbolization options expanded below. This allows you to color the symbols according to various categories: By collision severity, by motor vehicle involved with, or by collision type. Each category shows the name and number of collisions of each type and by clicking on the type, they can be turned off/on in the map.
- Clusters: Clusters aggregate nearby crashes into single larger points.This helps to synthesize areas with large numbers of crashes. Clusters change size depending on the number of records represented in black text. Clicking on a cluster shows a popup summary with the ability to scroll through the individually represented collisions and the details page can be accessed for each of them.
-
Heatmap: When heatmap is selected, crashes will be displayed as a matrix of colors where the dependent variable is the density of crashes. Blue areas represent lower numbers of crashes while red areas represent the highest crash counts. Depending on the scale of your map, you may desire to adjust the blur radius. This adjusts how close pixels are determined to be related and can have a drastic effect on the output. You can adjust the blur radius by the slider control in the widget.
Select Collisions
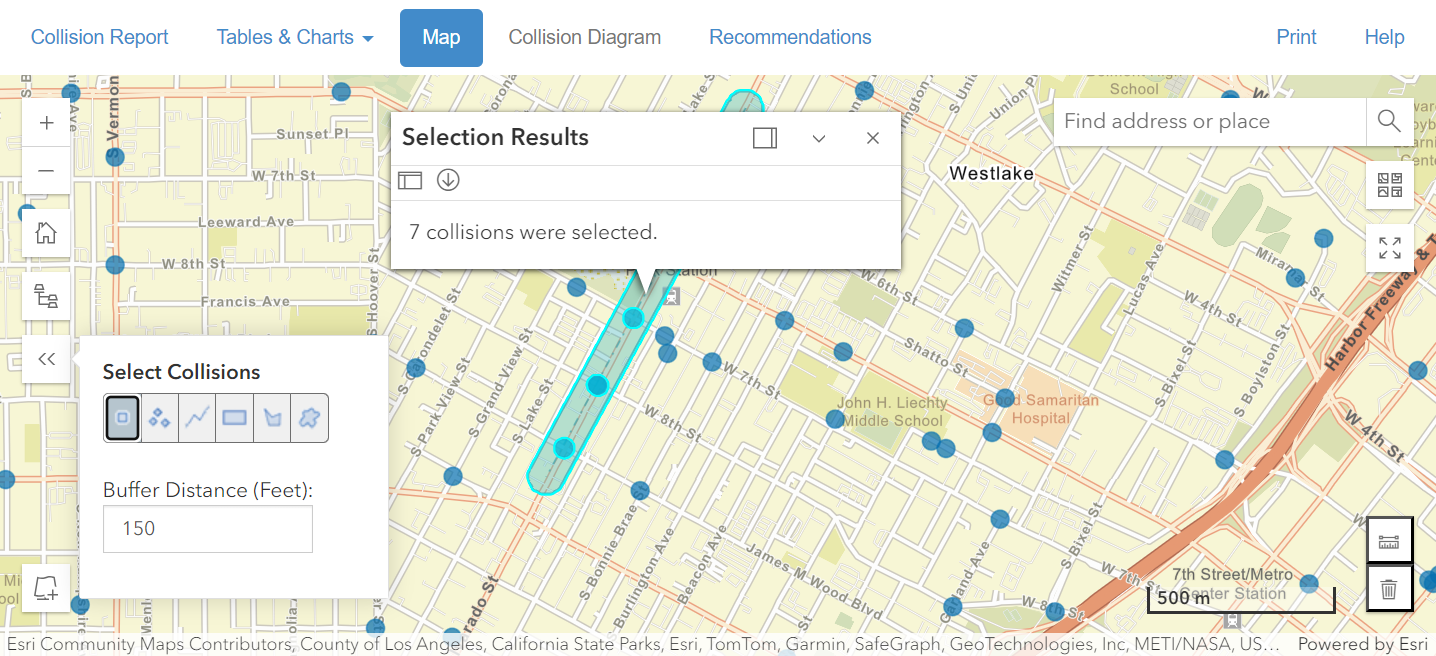
A key feature of the map view is the ability to select collisions of interest in a region, corridor or intersection. After selecting the collisions you can download the a Google KML file or open a new results window to conduct further analyses.
Click on the select collisions widget, choose a drawing shape (point, polygon, freehand, etc.), choose a buffer distance if desired and then follow the instructions when clicking/drawing on the map. The selected records will be highlighted inside of the drawn shape. From the Selection Results dialog you can see the number selected and choose to open a new results window or download a Google KML file. The new results window will allow you to access a collision report and all the functionality in the other tabs for only those selected collisions where you can also download the records or reports in csv, excel or PDF formats. Also the the collision diagram is only activated via this option or by viewing a specific intersection history on the main query page.
Add ArcGIS Server Feature Layer
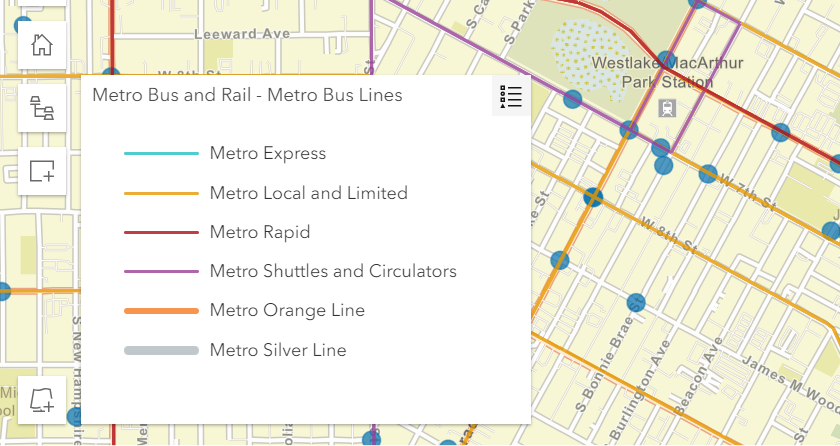
The widget in the bottom left corner allows you to add a valid ArcGIS Server Feature Layer to display on the map with its associated legend. Simply paste the
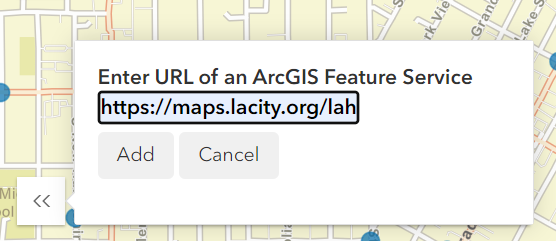
URL of your layer into the dialog and it will be displayed on the map temporarily during the browser session. This powerful feature allows you to reference crashes locations next to your own data such as bus routes or other points of interest
Find address
In the top right of the map, the find address widget allows you to search for and zoom to a specific address or intersection, by typing the full address, city and state into the box.
Change basemap
Below the find address is the basemap widget. Clicking on the widget will show several different options for a basemap background such as imagery or topography.
View fullscreen
Click the fullscreen widget to view only the map in fullscreen.
Measurement Tool
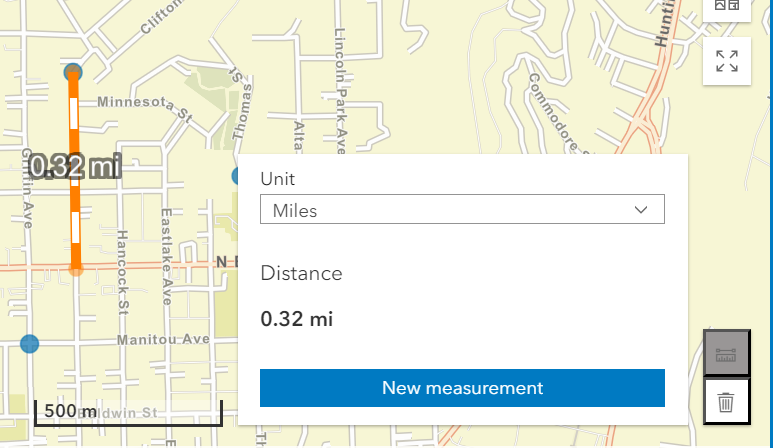
This tool can be accessed from the bottom right corner widget. Click on the measure icon and follow the directions on the map to calculate a measurement and choose a unit of measurement. Disgard the measurement by clicking on the trash can widget.
View Details Popup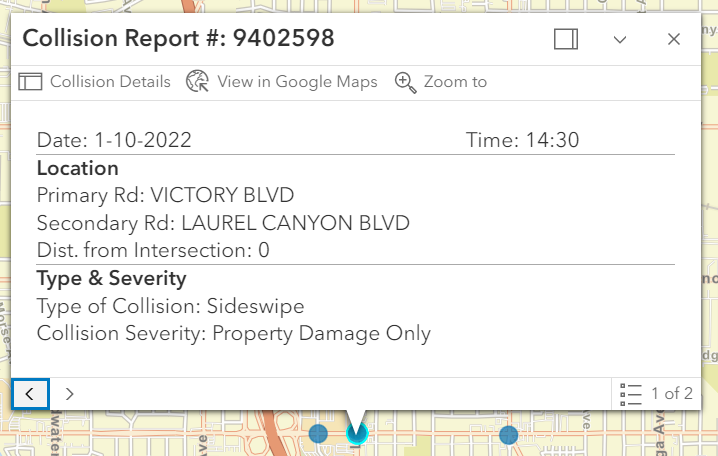
The collision details also gives full access to all the raw data fields available for the collision at the bottom of the page. Click on the categories to expand each of the data types.

