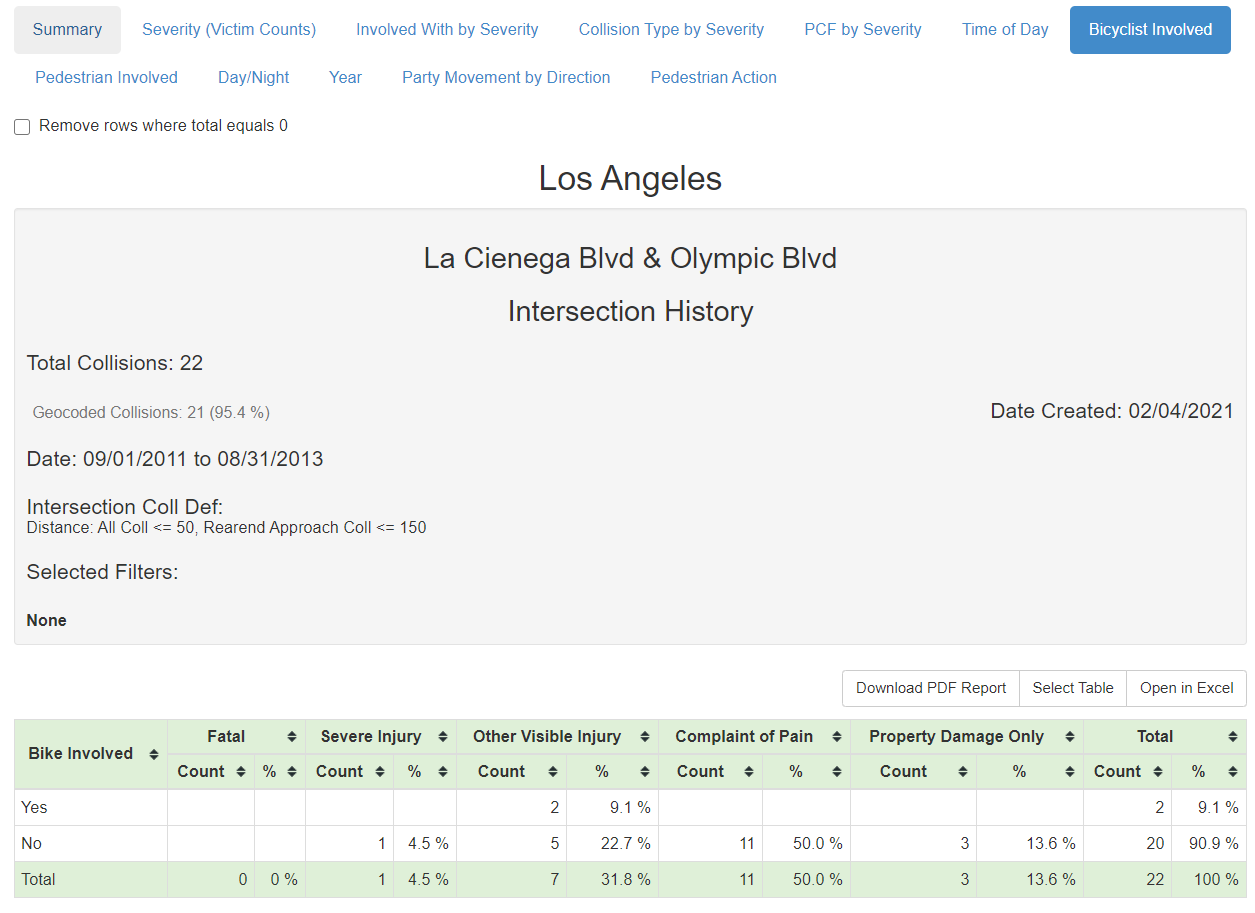
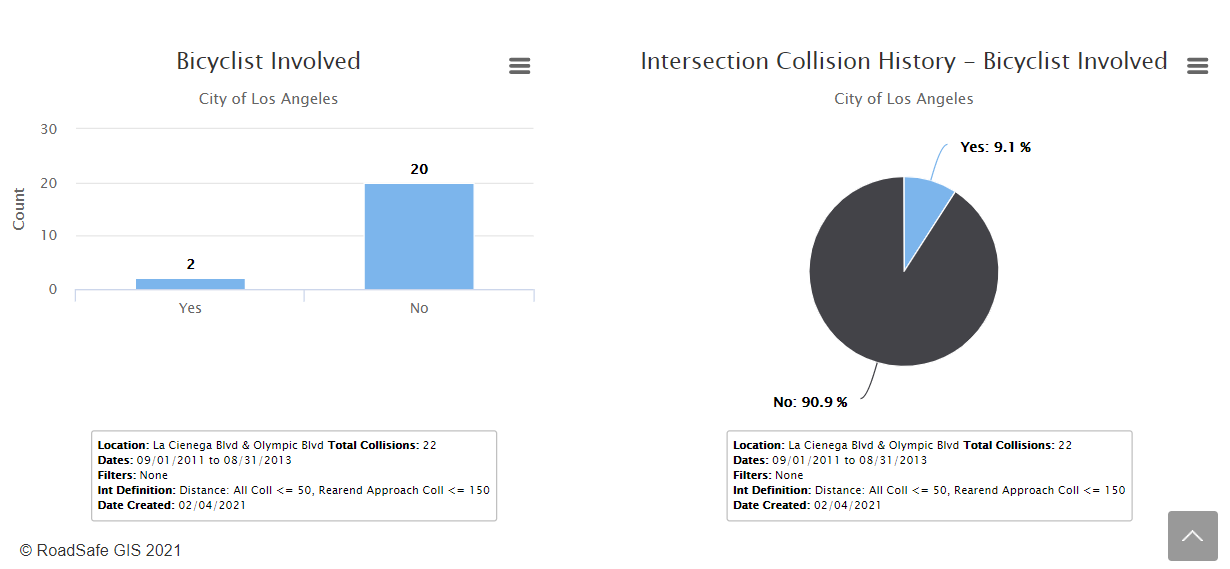
The Tables & Charts results page provides tables and charts to review and download as PDF or Excel reports or copy/paste into another document or email. It contains a summary section followed by the selected tables and charts:
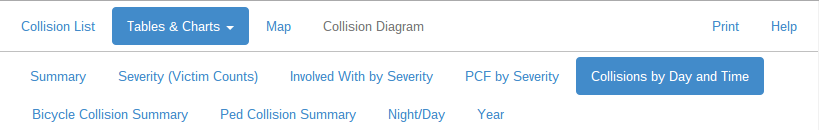
The top level menu options allow you to select a specific type of data distribution. Click the different options to refresh the results.
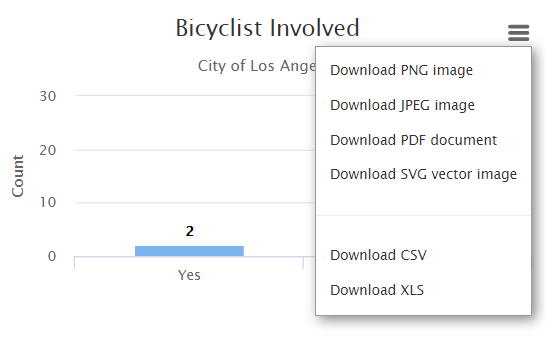
All of the tables and charts can be exported to PDF or downloaded as an Excel table of the values. The charts also have the option of downloading as images. Click the top right bars to access the different export options: